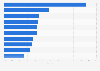
Toyota Motor Corporation: motor vehicle sales by region 2017-2023

Toyota Motor Corporation's motor vehicle sales between FY 2017 and FY 2023, by main region

Download
Show detailed source information?
Register for free
Already a member?
Log in
Source

Use Ask Statista Research Service

Release date

May 2023

Region

Worldwide

Survey time period

FY 2017 to FY 2023

Supplementary notes

The figures for 2013 through 2020 were taken from previous editions.
The values have been rounded.
The figures are for the years ending March 31.

Data includes the Toyota, Daihatsu, and Hino brands.

Citation formats
Statista Accounts: Access All Statistics. Starting from $2,388 USD / Year
Basic Account
Get to know the platform

You only have access to basic statistics.
This statistic is not included in your account.

Starter Account
The ideal entry-level account for individual users
  • Instant access to 1m statistics
  • Download in XLS, PDF & PNG format
  • Detailed references
$199 USD / Month *
Professional Account
Full access

Business Solutions including all features.

* Prices do not include sales tax.

Other statistics that may interest you Toyota Motor Corporation

Overview

6

Financials

6

Segments

6

Competitors

8

Further related statistics

15
Statista Accounts: Access All Statistics. Starting from $2,388 USD / Year
Learn more about how Statista can support your business.